Significant Proteins Stacked Bars (ggplot2)
Source:R/Benchmarking_Single.R
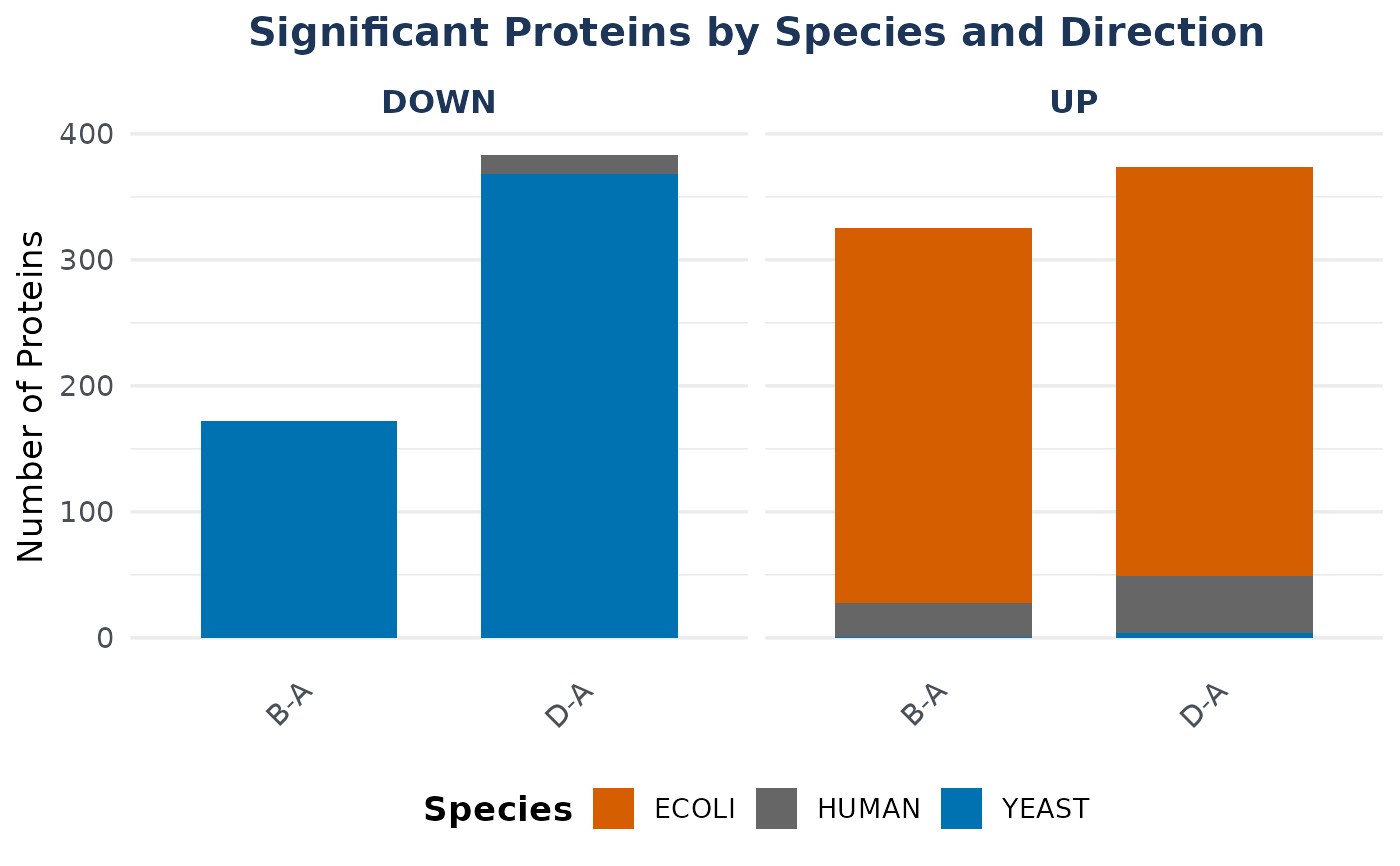
benchmark_signif_bars_gg.RdStacked bar chart of significant proteins by species, faceted by direction (UP/DOWN).
Usage
benchmark_signif_bars_gg(
  classified_df,
  ev = NULL,
  species_colors = NULL,
  title = "Significant Proteins by Species and Direction"
)Details
Counts every protein the pipeline called significant, whatever the direction.
A spike-in found significant with the sign inverted is an FN, so it carries
predicted = 0, but it is still a significant protein and belongs in the
facet its observed logFC points to – which is precisely the facet that
reveals the problem.
Examples
data(nadia_dia)
de <- process_proteomics(nadia_dia, verbose = FALSE)$DEPs_results
sp <- utils::read.delim(system.file("extdata", "nadia_dia_spikein.tsv.gz",
                                    package = "NADIA"))
de$Species <- sp$PG.OrganismId[match(de$Protein.IDs, sp$PG.ProteinGroups)]
ev <- data.frame(Comparison = rep(c("B-A", "D-A"), each = 2),
                 Species = c("ECOLI", "YEAST"),
                 expected_logFC = c(1, -0.58, 2, -3.3))
bench <- benchmarking_proteomics(de, ev, verbose = FALSE)
benchmark_signif_bars_gg(bench$classified_df, ev)