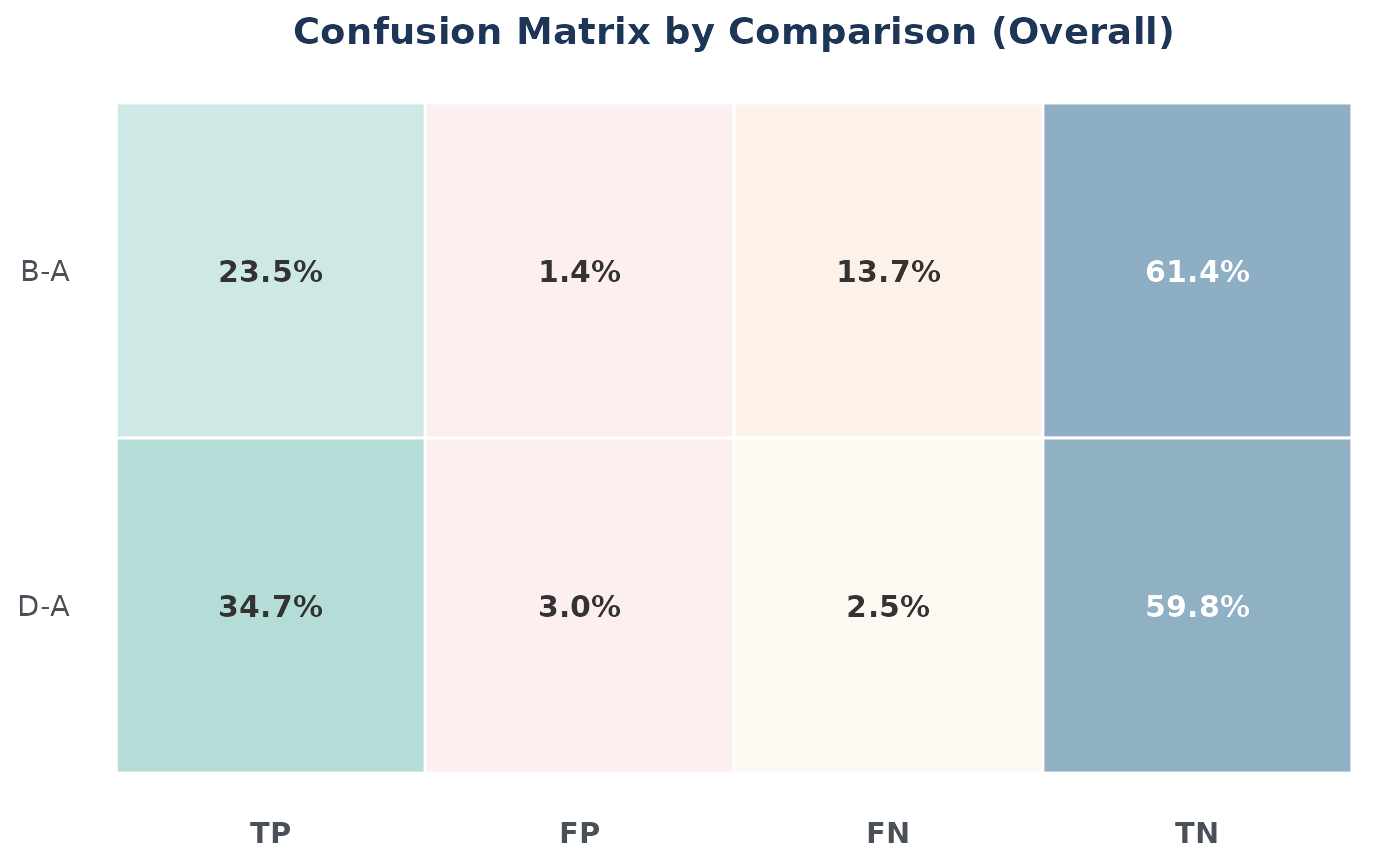
Overall Confusion Matrix Heatmap (ggplot2)
Source:R/Benchmarking_Single.R
benchmark_confusion_overall_gg.RdHeatmap of Comparisons x (TP%, FP%, FN%, TN%) aggregated across all species, with white-to-blue gradient fill by percentage.
Usage
benchmark_confusion_overall_gg(
  confusion_overall_df,
  title = "Confusion Matrix by Comparison (Overall)",
  text_size = 4,
  axis_text_size = 11
)Examples
data(nadia_dia)
de <- process_proteomics(nadia_dia, verbose = FALSE)$DEPs_results
sp <- utils::read.delim(system.file("extdata", "nadia_dia_spikein.tsv.gz",
                                    package = "NADIA"))
de$Species <- sp$PG.OrganismId[match(de$Protein.IDs, sp$PG.ProteinGroups)]
ev <- data.frame(Comparison = rep(c("B-A", "D-A"), each = 2),
                 Species = c("ECOLI", "YEAST"),
                 expected_logFC = c(1, -0.58, 2, -3.3))
bench <- benchmarking_proteomics(de, ev, verbose = FALSE)
benchmark_confusion_overall_gg(bench$confusion_overall)