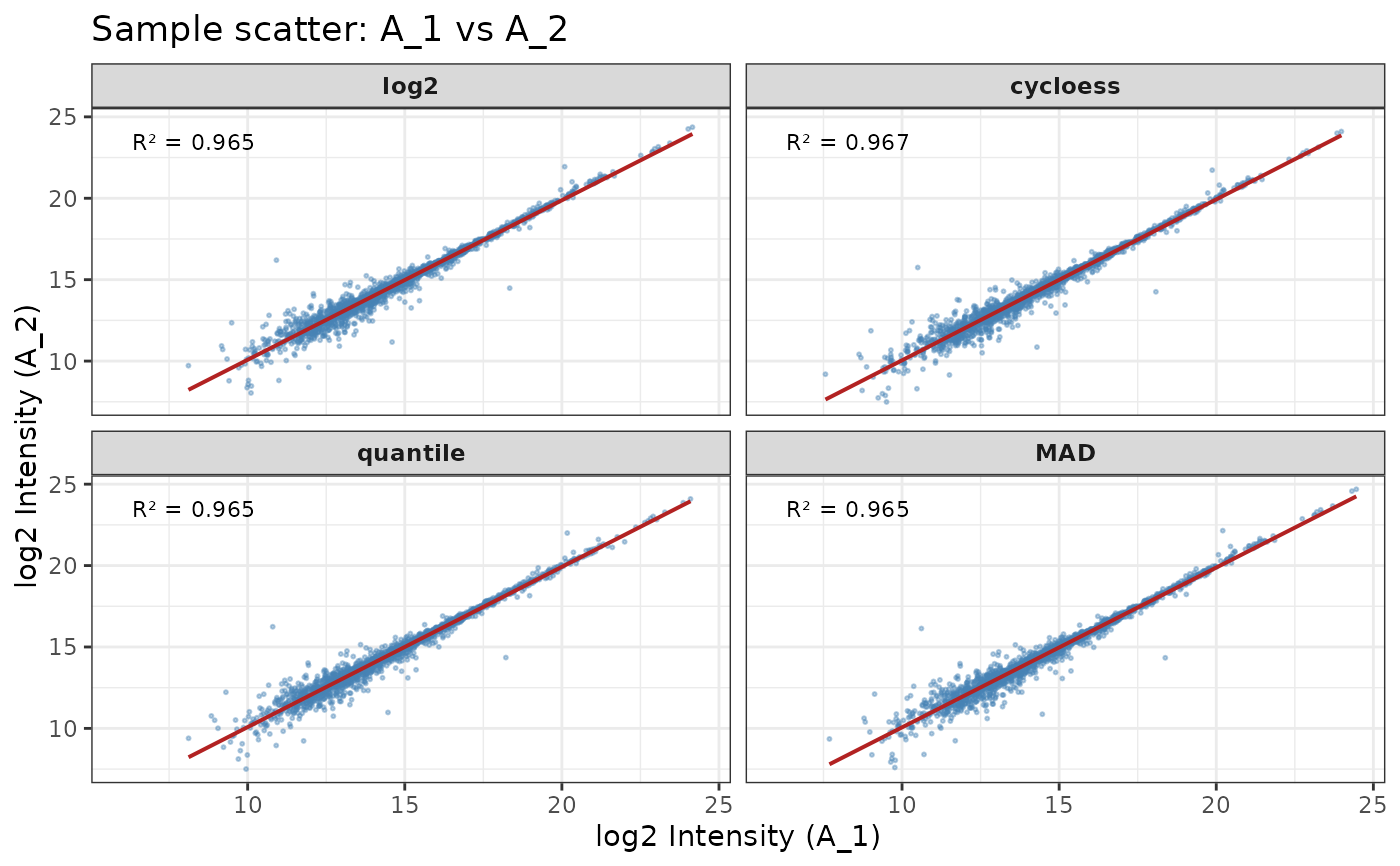
Sample-vs-sample scatter plot per method (NormalyzerDE style)
Source:R/Normalization_Metrics.R
nm_plot_scatter.RdPlots log2-intensity of one sample against another, one point per protein, for each normalization method. A linear fit and the adjusted R^2 are overlaid. Default comparison uses the first two columns of the SE (as NormalyzerDE does).
Usage
nm_plot_scatter(
  se,
  assay_names = NULL,
  condition_col = "Condition",
  sample1 = NULL,
  sample2 = NULL,
  ...
)
Arguments
- se
SummarizedExperiment from
import_norm_matrices().- assay_names
Character vector of assay names to include. NULL = all.
- condition_col
Column in colData with condition labels.
- sample1
Character. Name of the first sample (x-axis). Default = first column of
se.- sample2
Character. Name of the second sample (y-axis). Default = second column of
se.- ...
Additional arguments (unused).
Examples
data(nadia_dia)
se <- nm_prepare_se(nadia_dia, verbose = FALSE)
se <- nm_run_normalizations(se, methods = c("cycloess", "quantile", "MAD"),
                            verbose = FALSE)

nm_plot_scatter(se, sample1 = "A_1", sample2 = "A_2")