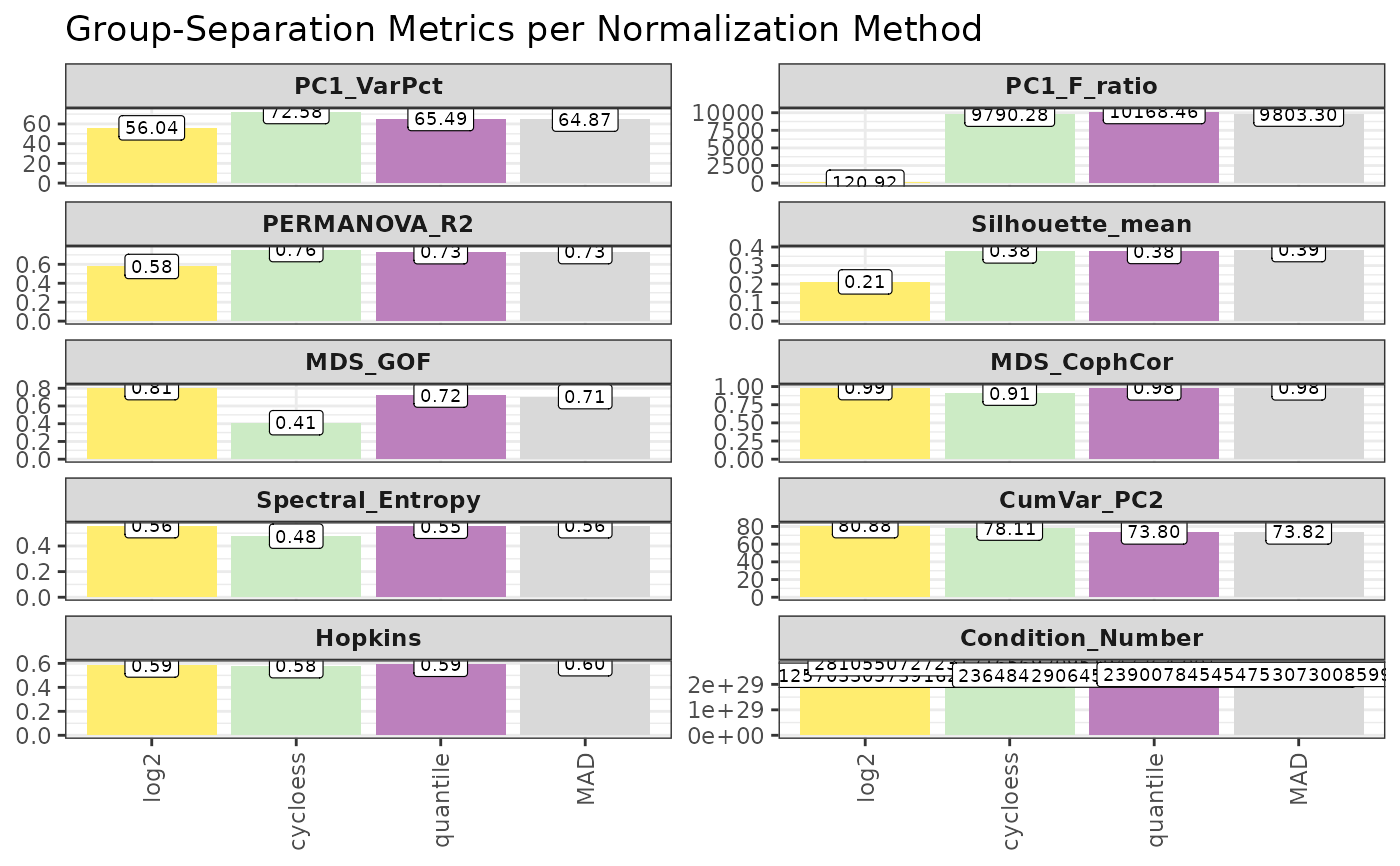
Bar chart of group-separation metrics per normalization method
Source:R/Normalization_Metrics.R
nm_plot_metrics.RdCalls nm_compute_metrics() internally and produces a faceted bar chart
(one facet per metric, free y-scales) with labeled values.
Arguments
- se
SummarizedExperiment from
import_norm_matrices().- assay_names
Character vector of assay names to include. NULL = all.
- condition_col
Column in colData with condition labels.
- seed
Integer. Seed for the two metrics that use randomness: the Hopkins statistic, which samples random reference points, and the PERMANOVA p-value, which permutes the group labels. Without it neither column is reproducible between runs. The caller's RNG state is restored on exit. Default 42.
- ...
Additional arguments (unused).
Examples
data(nadia_dia)
se <- nm_prepare_se(nadia_dia, verbose = FALSE)
se <- nm_run_normalizations(se, methods = c("cycloess", "quantile", "MAD"),
                            verbose = FALSE)

nm_plot_metrics(se)