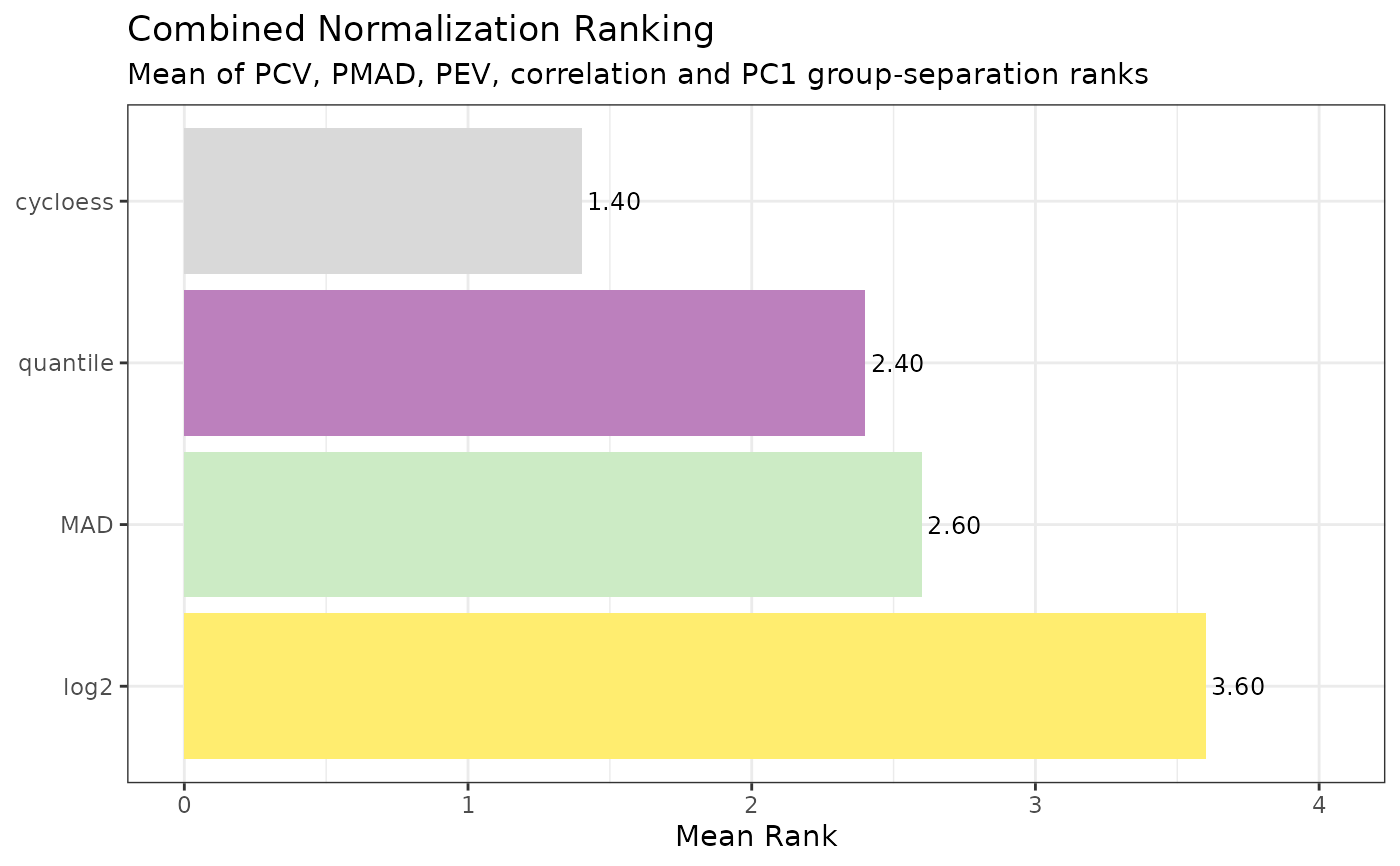
Horizontal bar chart of combined final ranking
Source:R/Normalization_Metrics.R
nm_plot_final_ranking.RdProduces a horizontal bar chart with normalization methods ordered by
ascending final rank (best at top). Uses the same PRONE-style palette
as other nm_plot_*() functions.
Usage
nm_plot_final_ranking(
  se,
  assay_names = NULL,
  condition_col = "Condition",
  cor_method = "pearson",
  ...
)
Arguments
- se
SummarizedExperiment from
import_norm_matrices().- assay_names
Character vector of assay names to include. NULL = all.
- condition_col
Column in colData with condition labels.
- cor_method
Correlation method forwarded to
nm_rank_final().- ...
Additional arguments (unused).
Examples
data(nadia_dia)
se <- nm_prepare_se(nadia_dia, verbose = FALSE)
se <- nm_run_normalizations(se, methods = c("cycloess", "quantile", "MAD"),
                            verbose = FALSE)

nm_plot_final_ranking(se)