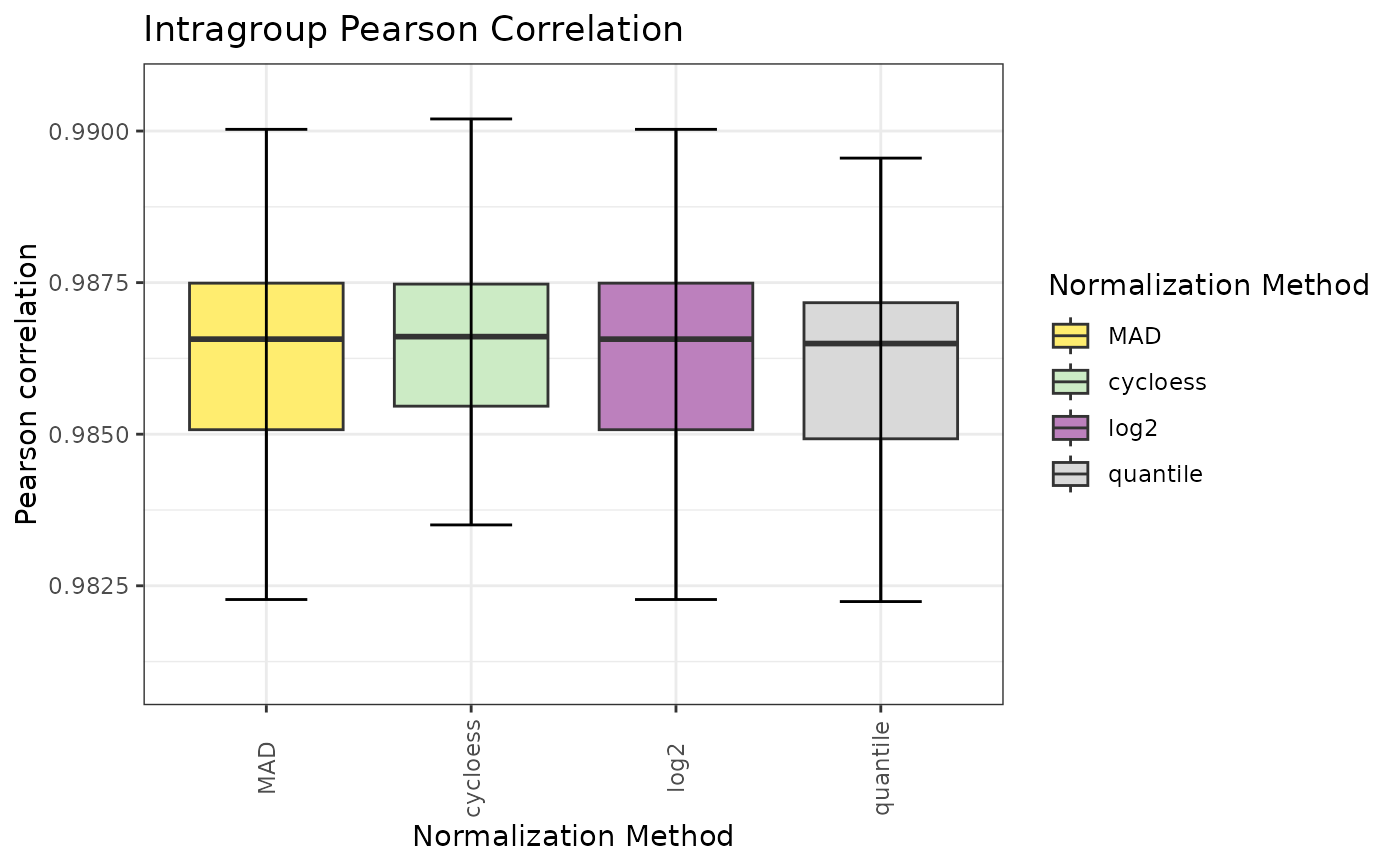
Intra-group correlation boxplot per method (PRONE-style)
Source:R/Normalization_Metrics.R
nm_plot_correlation.RdPairwise within-group correlations for each method shown as boxplots with error bars. Higher and less variable values indicate better normalization.
Usage
nm_plot_correlation(
  se,
  assay_names = NULL,
  condition_col = "Condition",
  cor_method = "pearson",
  ...
)
Arguments
- se
SummarizedExperiment from
import_norm_matrices().- assay_names
Character vector of assay names to include. NULL = all.
- condition_col
Column in colData with condition labels.
- cor_method
Correlation method passed to
cor():"pearson","spearman", or"kendall". Default"pearson".- ...
Additional arguments (unused).
Examples
data(nadia_dia)
se <- nm_prepare_se(nadia_dia, verbose = FALSE)
se <- nm_run_normalizations(se, methods = c("cycloess", "quantile", "MAD"),
                            verbose = FALSE)

nm_plot_correlation(se, cor_method = "pearson")