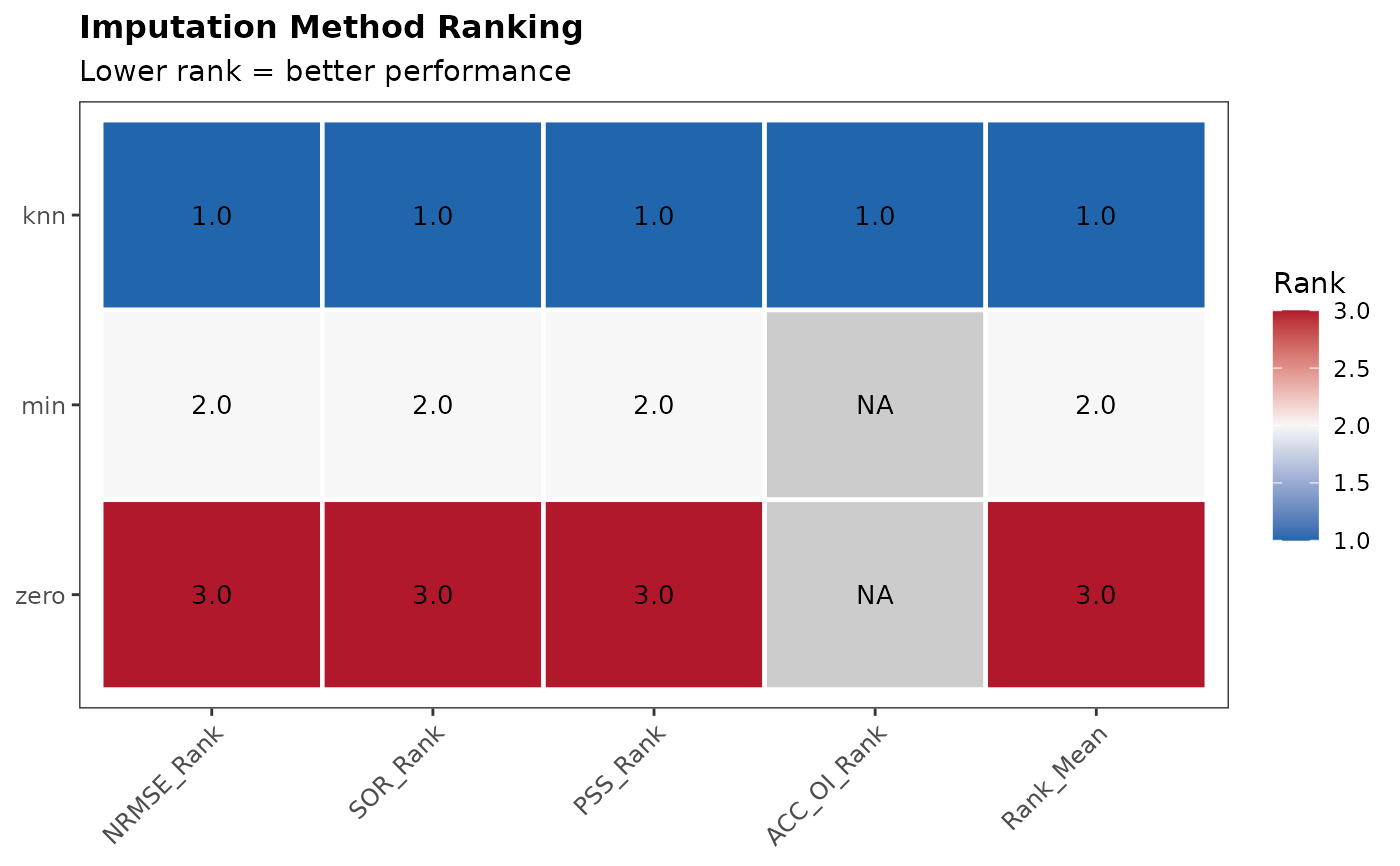
Heatmap (geom_tile + geom_text) showing per-metric ranks and the combined Rank_Mean. Rows = methods (ordered by Rank_Mean), columns = metrics.
Arguments
- metrics_df
data.frame from
im_compute_metrics().- ...
Additional arguments (unused).
Examples
data(nadia_dia)
se <- im_prepare_se(nadia_dia, norm_method = "cycloess", verbose = FALSE)
metrics <- im_compute_metrics(se, methods = c("min", "zero", "knn"),
                              verbose = FALSE)
im_plot_ranking(metrics)